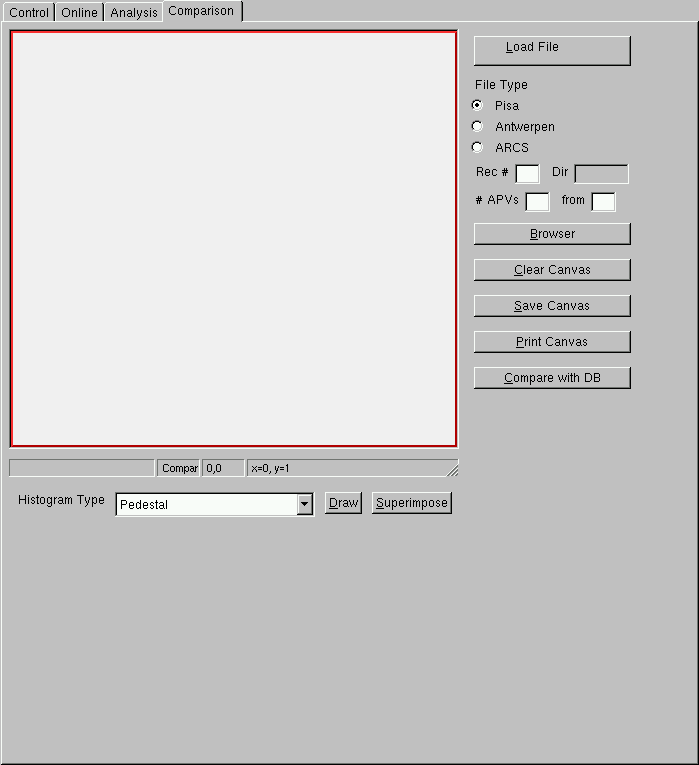
- Open File : A root file can be loaded
using "Load File" button.
This button would activate a "Dialog"
to select file name.
- File Type : The type of the root file
(Outputs from Pisa
Client/Lt Client/ARCS Client])
should be specified in the "Radio Button" after
loading the file.
- Rec# and Dir : The directory structure
in the root file should be specified here. In case of
Lt Client/ARCS Client the directory structure contains
a record (with a given number) and then under that, directories
like PeakInvOn, PeakInvOff, DecInvOn and DecInvOff depending on the
APV mode of data taking are saved. One has to specify it here to
select corresponding histograms. There are two
"Text Fields" and once has to specify
the number of the record and Directory Name.
- #APVs : In case of TT6Client output
root file one can specify the number of APVs to be plotted
and the starting APV number in the corresponding
"Text Fields". In case of Lt/ARC
client outputs the histogram is plotted for the whole module.
- Root Browser : Using
"Browser" button
one can open a "TBrowser" from ROOT.
Any histogram from the TBrowser can be plotted into the
"Embedded Canvas".
- Clear Canvas : The
"Embedded Canvas" can be
cleared using "Clear Canvas"
button.
- Save Canvas : Once one/more histograms are
plotted in the "Embedded Canvas", the
picture can be saved in postscript format using
"Save Canvas" button.
- Print Canvas : The plots in the
"Embedded Canvas" can be directly
printed in a printer using
"Print Canvas" button.
This would activate a dialog where the printing command should
be specified. But before using this button one MUST make sure
the printer is properly configured and is usable from the PC.
Comparison between Two/More Histograms :
To compare histograms one needs to load a RootFile
first using "Load File"
and select the Record Number and Directory properly for those
File Types where it is necessary. Then can use
"Draw" button to
draw the first histogram. After that, one or more histograms
can be superimposed on it using
" Superimpose " button.
This facility allows to compare histograms from different
directories of the same Root File or from different
files. For example one can compare the noise values from
at different temperatures (different records of Lt output)
etc.
The histograms to be plotted/compared can be selected in the
"pull down menu",
"Histogram Type". The list of the quantities are
Pedestal
Raw Noise
CM Noise
Maximum Calibration Charge
RiseTime
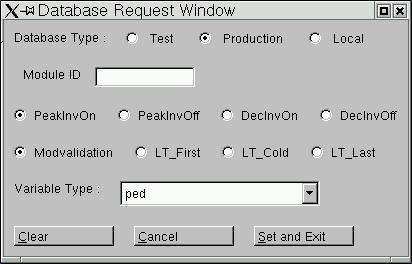
Comparison with Tracker Database :
One can compare a given histogram with the corresponding values stored in
the Tracker Database or with XML file to-be-stored in the Database. There
is a button "Compare with DB " for this
purpose. This button enables one "Pop Up Window "
where one can specify following options and use
"Set and Exist " button to
view the distribution in comparison with the Root File.
- The Root File MUST be
loaded before hand and the FileType should be selected
- For the comparison with
XML file once should make sure the corresponding file (for LT/ARC)
exists in the top directory of the application